Hotel turnover rate from federal data: quits equal to 48.6% of jobs a year in lodging and food service
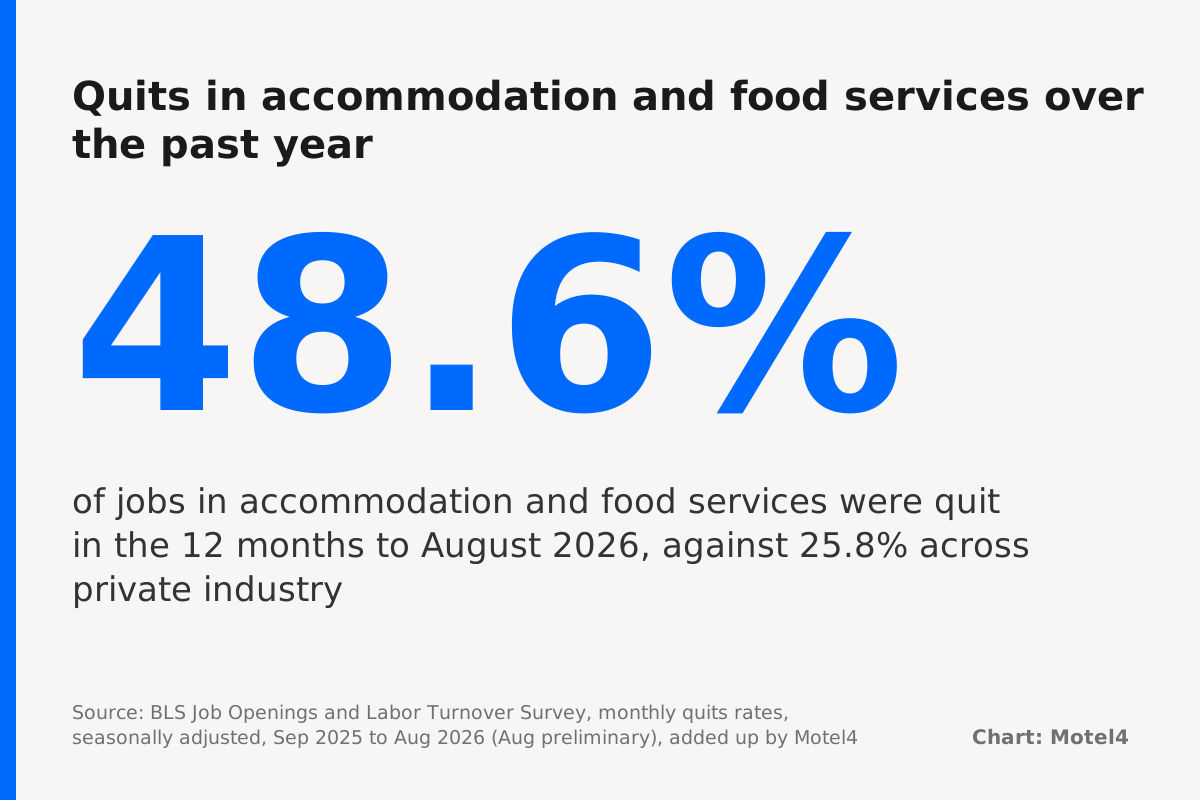
Workers in accommodation and food services quit at a rate of 3.5% in August 2026, against 2.1% across private industry, according to the Bureau of Labor Statistics’ Job Openings and Labor Turnover Survey released September 29, 2026 [1]. It is the newest federal reading on the hotel turnover rate, covering the group BLS puts hotels and motels in.
Add up the 12 monthly rates from September 2025 to August 2026 and quits equal 48.6% of the group’s jobs, against 25.8% in private industry as a whole [2]. For a 12-person motel team that is about 6 quits a year before a single layoff. The sections below turn it into replacement hires you can budget for.
Lodging and food service workers quit at nearly twice the private-sector rate
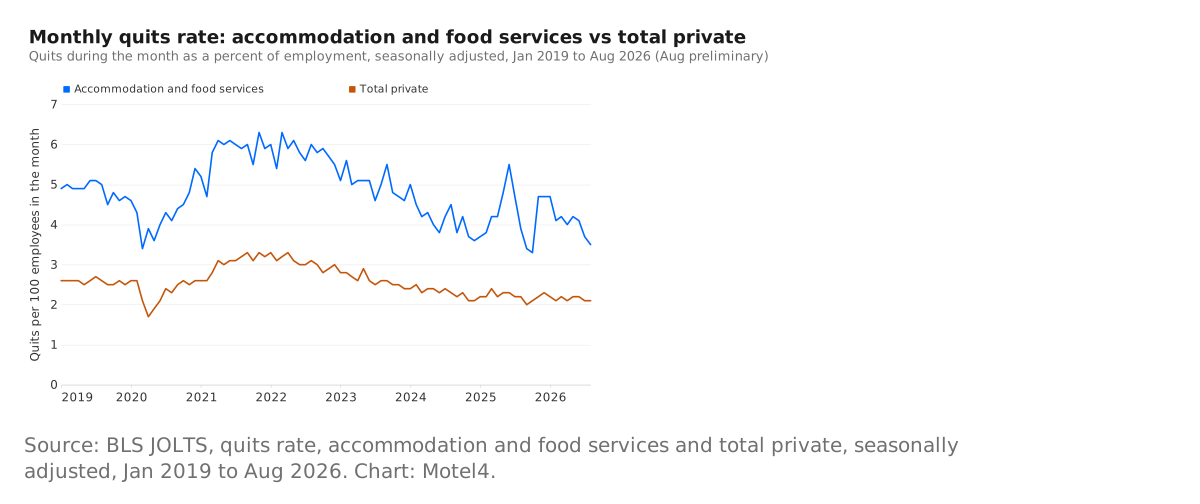
The chart shows the monthly quits rate since January 2019 for accommodation and food services beside total private industry, seasonally adjusted [2]. The gap never closes. In January 2019 the two lines stood at 4.9% and 2.6%; in August 2026 they stand at 3.5% and 2.1% [2].
The peak came in November 2021, when 6.3% of the group’s workers quit in one month [2]. Calendar 2022 was the worst full year, with monthly rates adding to 70.0% of jobs, and 2025 came in at 50.9% [2]. The rate has cooled below 2019, when the 12 months added to 58.4% [2].
A quits rate is “the number of quits during the entire month as a percent of employment”, and quits “are generally voluntary separations initiated by the employee” [1]. Retirements and transfers to another location count as other separations, so the series measures people who chose to leave [3].
A 12-person team replaces about 8 people a year at these rates
Take a motel with 12 people on the payroll: the owner, two desk clerks, a night auditor, six housekeepers and two maintenance and laundry staff. At the group’s rates over the past 12 months, quits alone come to 5.8 people a year [2]. Layoffs, discharges and other separations add 16.4% of employment, so total separations reach 7.8 people [2].
Hires over the same 12 months equalled 67.6% of employment, or 8.1 people on a 12-person team [2]. Each hire is one trip around the loop below: a housekeeper quits, the owner covers the open shifts, you post the job and interview, you train the new hire, and the team is back to full strength.
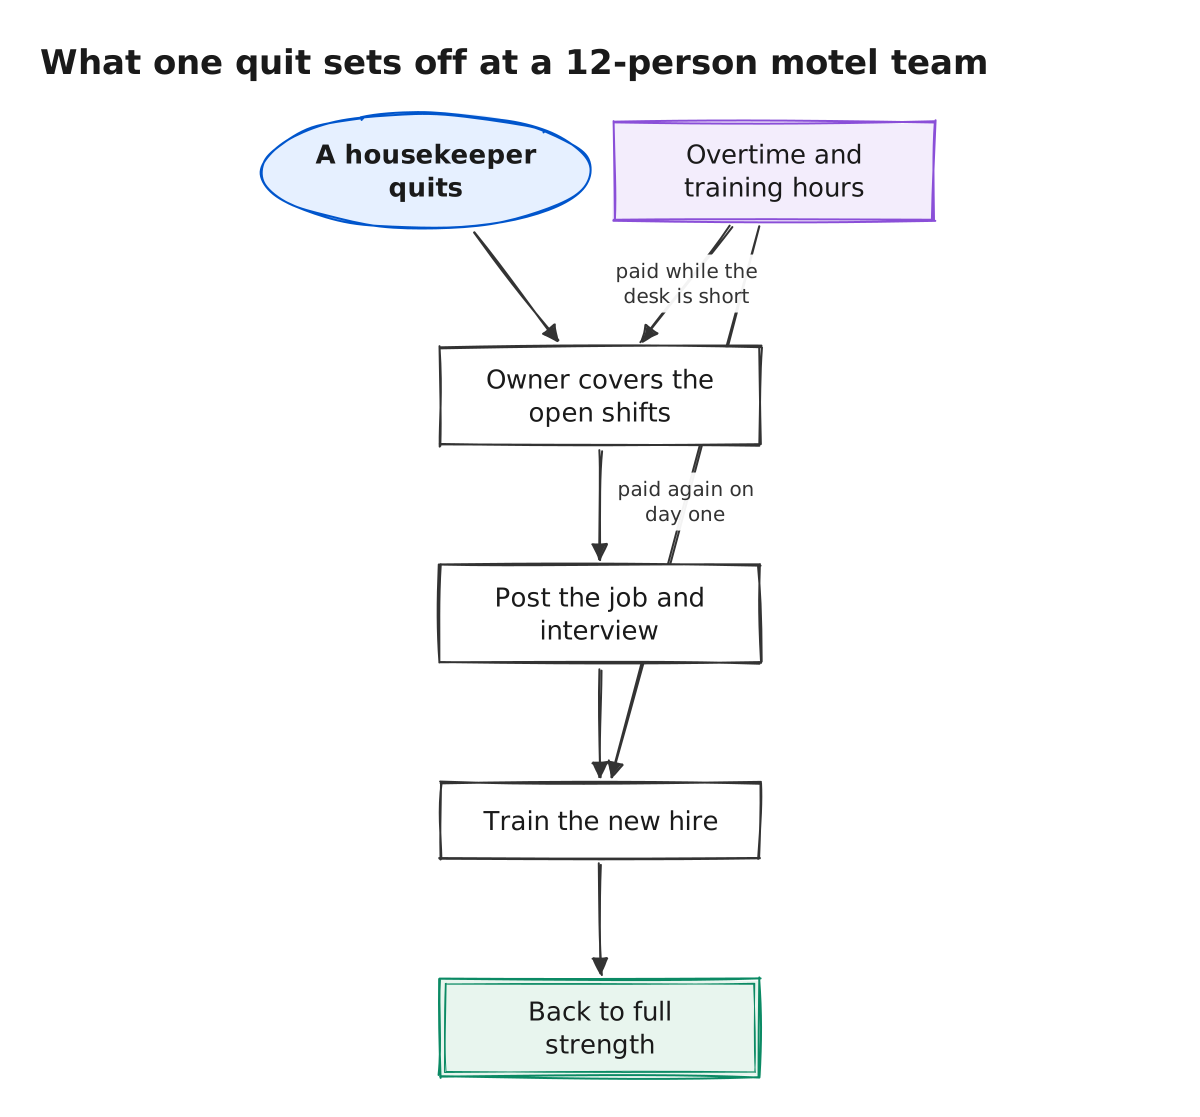
The overtime and training hours in between are the cost the quits rate does not show. Every new desk clerk also has to learn the rates, policies and directions callers ask about, which is why a written set of hotel phone scripts shortens the loop.
BLS does not split the lodging group by employer size. Across all private industry, though, establishments with 10 to 49 employees had a quits rate of 2.5% in August 2026, above the 1.8% at establishments with 1 to 9 employees and the 2.1% private average [1]. Being small does not, on its own, protect a payroll from quits.
How we got the numbers
We pulled nine JOLTS series through the BLS public data API on October 29, 2026 [4]. They are the quits, hires, total separations and layoffs rates for accommodation and food services and for total private industry, seasonally adjusted, January 2019 to August 2026 [2]. The August values match Table 4 of the news release [1].
The 12-month and calendar-year figures are plain sums of the monthly rates, which is our arithmetic and not a BLS table. The data file is published with this post, and how we write explains how each number was checked against it.
What the numbers do not tell you
To be fair, the JOLTS group is mostly restaurants. BLS publishes quits for accommodation and food services together, and in September 2026 accommodation held 1,916,500 of the group’s 14,309,500 payroll jobs, or 13.4% [5]. Hotels and motels could run higher or lower than the group, and nothing published monthly can say which.
The August 2026 figures are preliminary and BLS revises them the next month; the September release is due November 3, 2026 [1]. The rates are national and seasonally adjusted, so a beach motel’s summer will look nothing like the smooth line.
The 12-month sums also count a job twice if it turned over twice. So 48.6% does not mean half of your staff left; it means quits equal to half the payroll.
Verdict
Use 48.6% as your benchmark if you run a motel with a mixed team of housekeepers, desk clerks and maintenance: it is what quits came to across the federal lodging and food service group in the 12 months to August 2026 [2]. Count your own quits for a year and divide by average headcount to compare.
Pick the group’s hires rate, 67.6%, if you are budgeting hiring time rather than measuring loyalty, because it includes layoffs and seasonal churn [2]. Choose your own count over either if you have it; the federal series is the fallback, not the final word.
Either way, write the number down before the next release. The 3.5% that opened this post was one month and preliminary, and the series has moved by a full point within a year more than once since 2019 [1][2].
How we did this
Data from the BLS Job Openings and Labor Turnover Survey (monthly quits, hires and separations rates for accommodation and food services and total private industry, seasonally adjusted, January 2019 to August 2026, pulled Oct 29, 2026 through the BLS public API) and from Table B-1 of The Employment Situation for September 2026; the data files are published with this post. Search demand from Google Keyword Planner (US, pulled Oct 29, 2026). Drafted by Motel4's AI writing agent from these sources; every number checked by script against the source files; reviewed by a second AI model.
Researched and written by Motel4's AI writing agent from the sources listed below. Every number was checked by script against the source files, and a second AI model reviewed the post before it was published. The Motel4 Team is responsible for this page.
Sources
- U.S. Bureau of Labor Statistics, Job Openings and Labor Turnover, August 2026 (news release, Tables 4 and 7) (primary source), accessed Oct 29, 2026.
- U.S. Bureau of Labor Statistics, Job Openings and Labor Turnover Survey, monthly series JTS720000000000000QUR and JTS100000000000000QUR (primary source), accessed Oct 29, 2026.
- U.S. Bureau of Labor Statistics, JOLTS definitions (primary source), accessed Oct 29, 2026.
- U.S. Bureau of Labor Statistics, BLS Public Data API (primary source), accessed Oct 29, 2026.
- U.S. Bureau of Labor Statistics, The Employment Situation, September 2026, Table B-1 (primary source), accessed Oct 29, 2026.

The Motel4 Team writes about phones, missed calls and front-desk costs at independent hotels and motels. Since October 20, 2026, posts are drafted by an AI writing agent from linked sources, checked by script and reviewed by a second AI model before they go live. How we write. To reach us or report an error: motel4.ai/contact.